
Electrical Resistivity Tomography (ERT)
About Electrical Resistivity Tomography (ERT) Survey
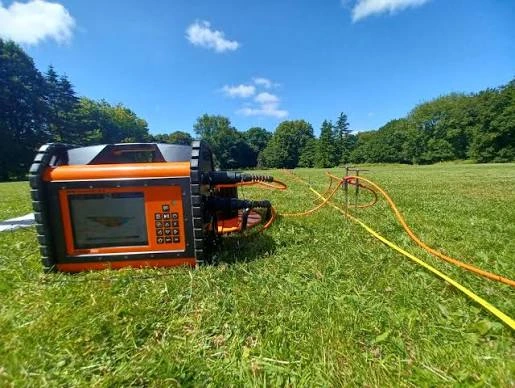
Electrical Resistivity Tomography (ERT) Survey is a widely used geophysical investigation technique for developing a detailed understanding of subsurface conditions. It is a direct-current (DC) electrical resistivity method in which controlled electrical current is introduced into the ground through a series of electrodes, while the resulting electrical potential is measured at different electrode configurations. The collected measurements are processed and interpreted to generate a two-dimensional resistivity model of the subsurface.
The electrical resistivity of geological materials varies according to several physical and geological factors, including rock and soil type, porosity, moisture content, degree of saturation, groundwater conductivity, fracturing and weathering. These variations provide valuable information for interpreting changes in subsurface geology and identifying zones that may require further investigation. Depending on the site conditions, an ERT survey can be used to investigate subsurface layering, lithological boundaries, geological structures, fractures, cavities, sinkhole-prone zones and potential groundwater-bearing formations.
Applications of ERT Survey
An ERT survey for groundwater exploration is particularly useful where groundwater occurrence is controlled by weathered or fractured formations. The technique can help delineate resistivity contrasts associated with different geological and hydrogeological conditions and can therefore support borewell site investigation, aquifer assessment and groundwater exploration. ERT is also applicable to geological mapping, engineering investigations, environmental studies, cavity detection and subsurface characterization.
For complex sites, ERT data can be integrated with other geophysical techniques to improve the interpretation of anomalous areas. Depending on the project objectives, complementary methods may include Ground Penetrating Radar (GPR), electromagnetic surveys, seismic refraction and Multi-Channel Analysis of Surface Waves (MASW). Combining different geophysical datasets can provide a more comprehensive understanding of subsurface conditions than relying on a single method alone.
Key Benefits of Electrical Resistivity Tomography (ERT) Survey
ERT offers several practical advantages for groundwater exploration, geological mapping and geotechnical investigations:
Non-invasive and eco-friendly – ERT does not require drilling or excavation, causing minimal disturbance to the land and environment.
Repeatable and suitable for monitoring – Surveys can be repeated over time to track changes in groundwater levels, saturation and subsurface conditions.
Versatile across environments – ERT works in diverse settings, from hard-rock terrains and alluvial plains to wetlands, mining areas and infrastructure sites.
Flexible survey design – Electrode spacing, array configuration and profile length can be adjusted to control investigation depth and resolution
Cost-effective compared to drilling – ERT reduces the need for excessive boreholes and test pits, helping to focus drilling on more promising targets.
Continuous 2D/3D subsurface imaging – Unlike point-based boreholes, ERT provides continuous resistivity sections that reveal lateral changes and geological boundaries.newtechgeo+1
High-resolution data for better interpretation – Modern ERT systems and inversion software produce detailed resistivity models that improve geological and hydrogeological analysis.
These advantages make ERT a valuable tool for scientific groundwater exploration and subsurface characterization before borewell drilling.
Key Benefits of Electrical Resistivity Tomography (ERT) Survey
ERT offers several practical advantages for groundwater exploration, geological mapping and geotechnical investigations:
Non-invasive and eco-friendly – ERT does not require drilling or excavation, causing minimal disturbance to the land and environment.
Repeatable and suitable for monitoring – Surveys can be repeated over time to track changes in groundwater levels, saturation and subsurface conditions.
Versatile across environments – ERT works in diverse settings, from hard-rock terrains and alluvial plains to wetlands, mining areas and infrastructure sites.
Flexible survey design – Electrode spacing, array configuration and profile length can be adjusted to control investigation depth and resolution
Cost-effective compared to drilling – ERT reduces the need for excessive boreholes and test pits, helping to focus drilling on more promising targets.
Continuous 2D/3D subsurface imaging – Unlike point-based boreholes, ERT provides continuous resistivity sections that reveal lateral changes and geological boundaries.newtechgeo+1
High-resolution data for better interpretation – Modern ERT systems and inversion software produce detailed resistivity models that improve geological and hydrogeological analysis.
These advantages make ERT a valuable tool for scientific groundwater exploration and subsurface characterization before borewell drilling.
How an Electrical Resistivity Tomography (ERT) Survey Is Performed
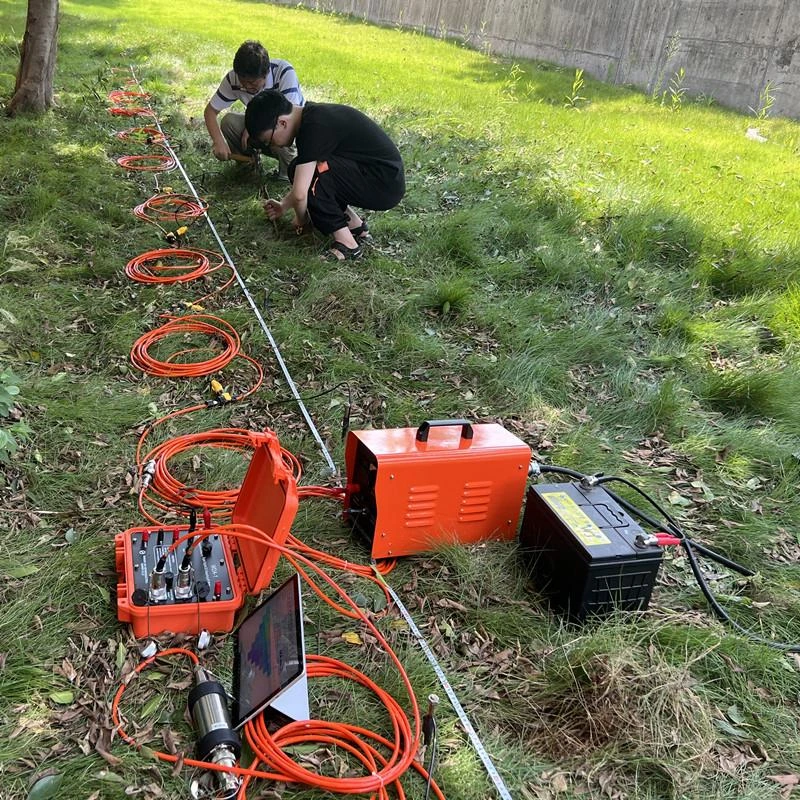
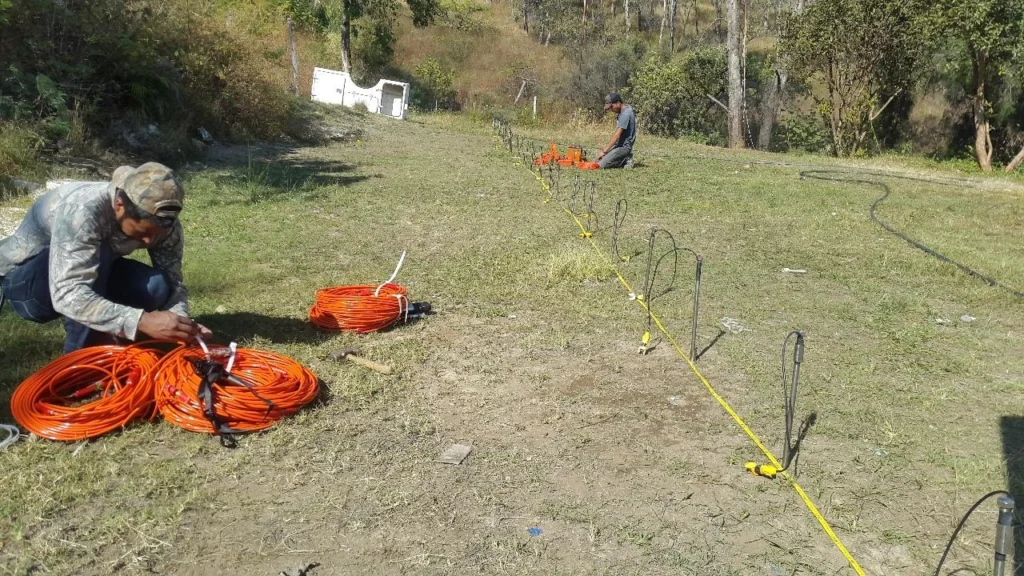
An Electrical Resistivity Tomography (ERT) survey measures subsurface resistivity by collecting a series of readings along a defined profile. Current is injected into the ground through electrodes placed at regular intervals, and the resulting voltage differences are recorded to generate apparent-resistivity data.
Electrode Array Configurations
ERT surveys can use different electrode array configurations, such as:
Wenner array
Schlumberger array
Dipole–dipole array
The choice of array depends on the investigation objective, expected geology, required depth and resolution. A qualified geophysicist selects the most suitable configuration on-site based on project requirements.epa+2
Depth of Investigation and Resolution
ERT provides a continuous dataset from near-surface layers to considerable depth. Both the depth of investigation and the achievable resolution depend primarily on:
Electrode spacing – Smaller spacing improves near-surface resolution but reduces investigation depth.
Profile length – Longer spreads allow greater depth, often at the expense of fine resolution.
In general, survey resolution is approximately half the electrode spacing, while depth of investigation is influenced by the total array length and configuration.epa+2
Factors Affecting Apparent Resistivity
Apparent resistivity values are influenced by several factors, including lithology, porosity, saturation, pore-fluid conductivity and near-surface conditions. Reliable interpretation therefore requires:
Understanding of local geology and hydrogeology.
Correlation with borewell logs, groundwater levels and surface observations.
Awareness of potential sources of noise, such as buried utilities, metal structures and power lines.
ERT data quality can be reduced in extremely resistive or highly conductive environments and in areas with significant surface noise.epa+2
Interpreting Resistivity Values
Different materials exhibit characteristic resistivity ranges:
High resistivity (low conductivity) – Typically associated with dry sand, gravel, compact rock or air-filled voids.
Low resistivity (high conductivity) – Commonly linked to clay, saturated formations, saline water or mineralised zones.
Accurate interpretation requires integrating resistivity patterns with geological context rather than relying on resistivity values alone.epa+1
Data Processing and Inversion
Raw apparent-resistivity measurements are processed using geophysical inversion (inverse modelling) techniques. This computational process converts field data into a two-dimensional resistivity model that represents the subsurface.
Key points about ERT imaging:
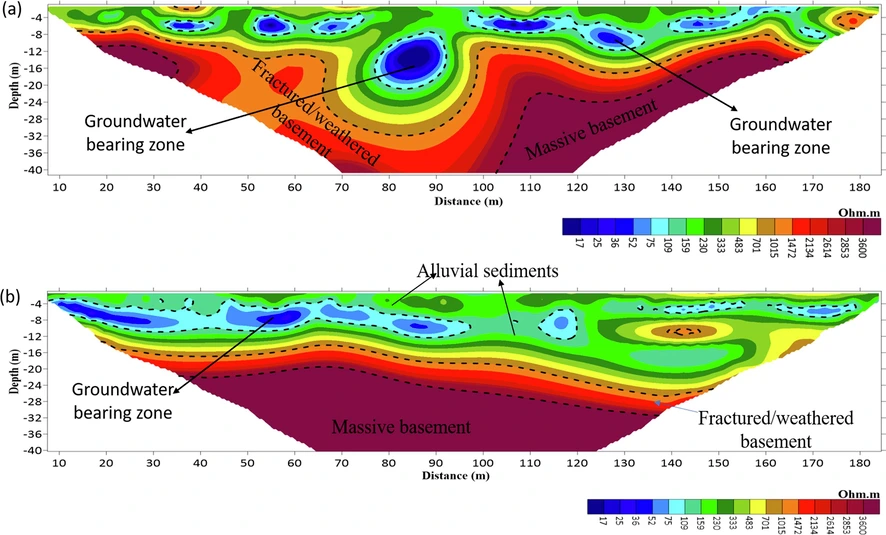
The final ERT section shows resistivity distribution with depth along the survey line.
Spatial resolution generally decreases with increasing depth.
The inverted model is interpreted alongside geological, hydrogeological and borewell information to identify possible aquifers, fractures, weathered zones and other targets.
Frequently Asked Questions
What is an ERT survey?
An ERT survey is a non-invasive geophysical investigation that measures subsurface electrical resistivity and produces an interpreted two-dimensional image of underground formations.
Can ERT locate groundwater accurately?
ERT can identify resistivity variations that may indicate weathered, fractured or saturated formations. However, it cannot provide an absolute guarantee of groundwater yield or quality. Confirmation requires drilling and well testing.
Is ERT better than conventional drilling?
ERT and drilling serve different purposes. ERT provides a broader subsurface image along a profile, while drilling provides direct information from a particular location. Using ERT before drilling can help improve site selection and reduce uncertainty.
How deep can an ERT survey investigate?
Investigation depth depends on electrode spacing, survey length, geological conditions, instrument capability, data quality and the target’s electrical contrast. Greater electrode spacing generally permits deeper investigation, but depth estimates should be confirmed by a qualified geophysicist.
What happens after the ERT survey?
The field data are processed and inverted to prepare a resistivity section. The interpretation is then correlated with geology and hydrogeology to identify possible target zones and provide recommendations for further investigation or drilling.
Get in touch
If you’d like to know more about our ERT services, other geophysical surveys, or to request a quote, please get in touch with our team.